Authorship
&
Interaction
ASFA AHMED
Authorship
Final Project
interactive
Storytelling
Interaction
Data
Gathering
Browser
Based
Processing
Interface Design
Interface Design Test
Theory
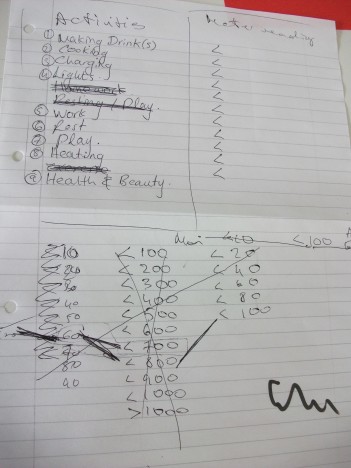
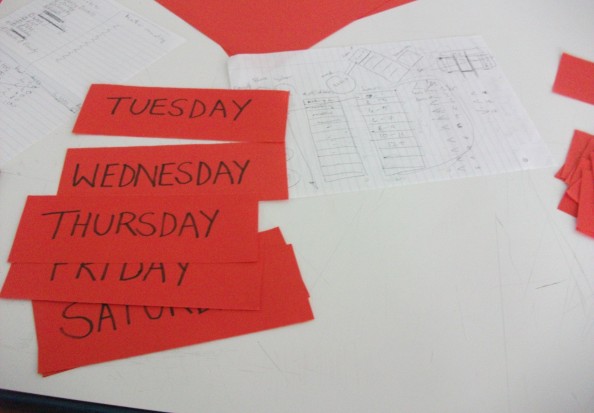
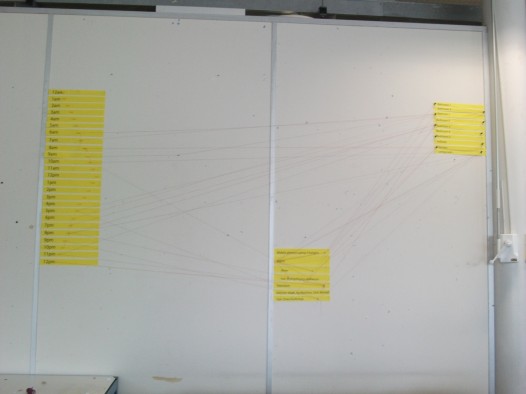
Everyone in the class teamed up into groups of four and gathered individual data about their energy consumption for a week. Each consumption could be written (like image in right) or they could choose to write down the gas and electric meter reading (like on the image above).
In the team we decided that in order to have more of a variety of data gathering, each of us would collect the data in the different ways. Between the four of us, the decision was that two of us should focus on collecting meter reading (gas and electric), and the remaining two would monitor their daily usage by writing down all they have used from gadgets to appliances.
The images above and on the right shows my data collection for that week, I choose to collect data both ways so i could differentiate the difference between them.
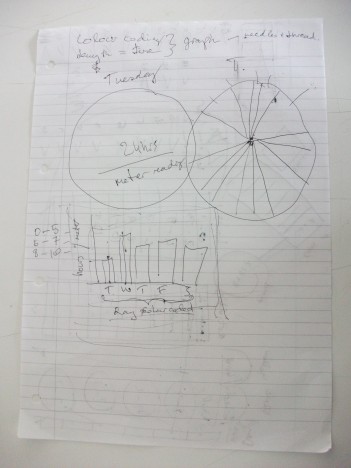
once the data was gathered, we decided to come up with an interface design in which we would be able to display both types of information. The aim was to display the data in such way that would make the user easily understand how much consumption they had used.
We knew that the only way the user was able to include their data by interacting with the design would be through the use of pins and thread. The easiest and most obvious ways of doing this was a bar chart, however as a team we decided that it is not interactive or very interesting enough.
we finally decided that they best way to separate the data would be through the use of colour coding. Which lead us to do a pie chart, however the pie chart did not allow the user with meter reading data to use it.
After removing idea after idea, we finally came up with a design which would allow the user to include either type of data. The design also allowed the data to be divided up so users would easily see what they used most and the least.
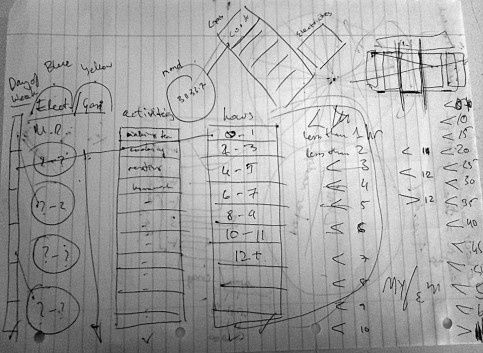
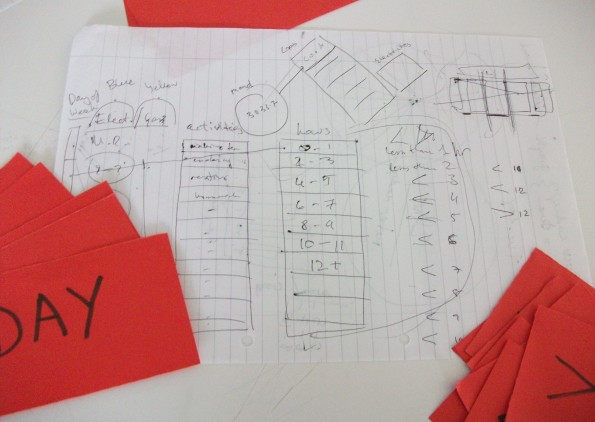
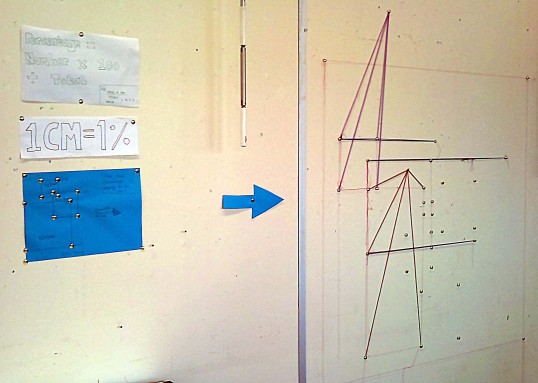
The two images above and the image on the left shows a sketch of our final interface design and our group starting to design the sketched idea physically.
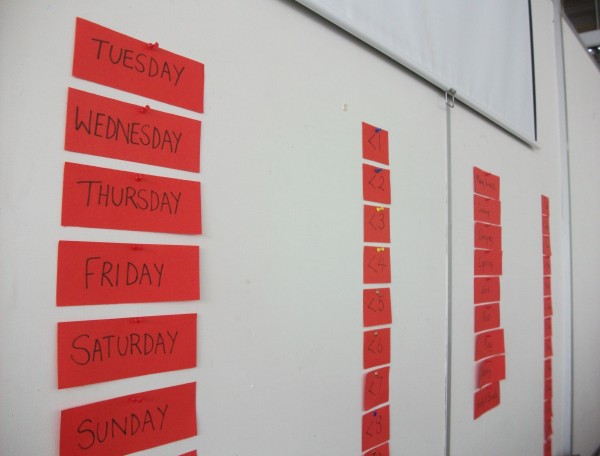
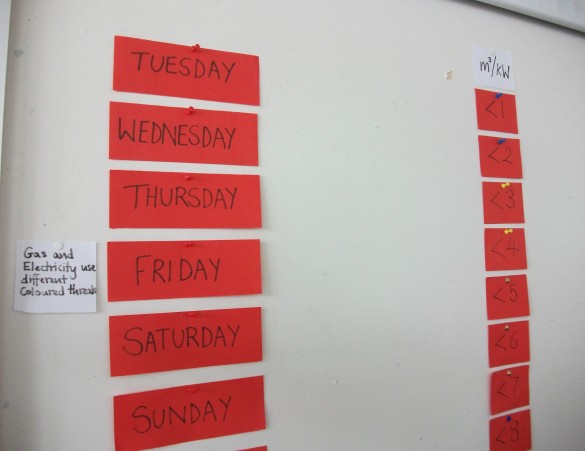
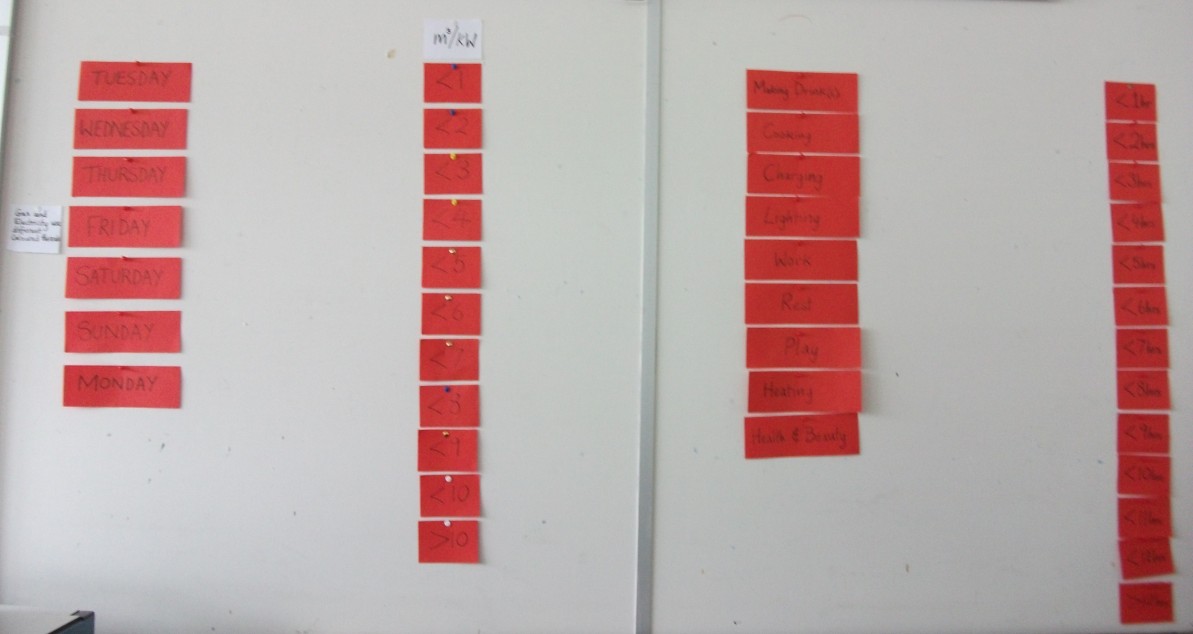
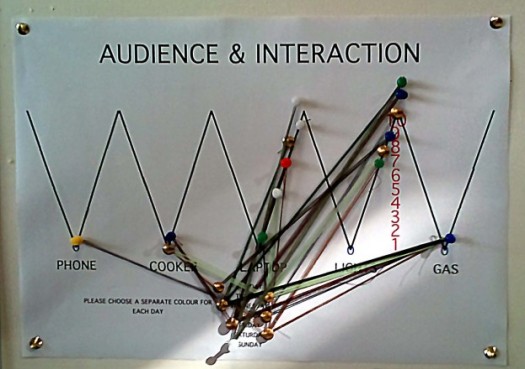
Below is an image of our final design. The first column shows the days, starting from Tuesday because that is the day when everyone started to collect their data.
In the second column, we created an meters cubed for gas or kilowatts for the electricity reading, however we found this to be most problematic to figure out because everyone would've had different numbers, so as a group we decided to focus on the amount used. If on Tuesday one used less than 3 kW of electricity, then they would use the tread which will go from Tuesday to < 3 kW.
The third shows the main categories, for which each activities would fall into. This allowed our users to be able to include all of their written gathered data.
The last column shows the time spent on that task, for example cooking for <2 hours.
Above two image are a close up of our final interface design.
By the end of the testing stage, this is how our interface looked after another group tested it. They did not understand what the second column was for and the people with the meter reading thought they could not use the design.
One person was confused about the third column, he did not understand that these were categories that all the activities and appliances used fall under.
It was not clear that if the user did not have a meter reading than they could skip the second column so if we was to develop this idea. Than we would give more information as to how this interface can be used to interact with. We would need to work on the display of the meter reading as using less than made the user confused.
Once the interfaces were developed, we than had to use out collected data and try to interact with another groups interface and test it.
We tested the interface above, it was an A3 size making the scale too small for all of use were unable to use it at once. The zig zags were not understandable and we were not able to finish it in time.
Two of us were unable to use it because there was no meter readings and there were no pins, just a page which made it hard for us to understand. There was lack of information.
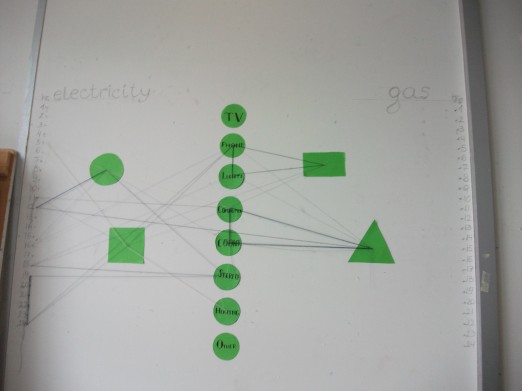
The image above and two images on the left are examples of interfaces produced by the other groups in our class.
By comparing ours to these we found that the user felt restricted as to how they were able to interact with it.
By listening to the users of these interfaces I also found that all of them had a lack of information of some amount and that the user was unable to understand how to use it instantly. Some people had included codes and some amount of information but even that was not useful for the users.